Memory leak after migrating from legacy Team to latest Level 4 Team

We had agno v1.1.5 and legacy agentic team handling approach. We use single instance of Team for all the user and as provided by agno users defined by user_id and session_ids.
The core problem is: after update to 1.7.0 agno and migrating Team handling to latest approach as provided in the examples and docs, we faced a huge memory leak. 10 parallel request to team leading to around 1.2GB memory growth and it never falls.
So far we suspect team.memory - we found out that it has a cleaning method, but it does not seem like a good approach either.

Does anybody faced same issues before? Could not really find anything related in the docs.

Hey @rast22, thanks for reaching out and supporting Agno. I’ve shared this with the team, we’re working through all requests one by one and will get back to you soon.
If it’s urgent, please let us know. We appreciate your patience!

1 Like

Hi @rast22
That is indeed serious. Can you provide some more information to help us replicate this situation? Like your team config and how you are running it to produce this case?

We have a Team with 3 included agents.

All agents have the same configuration, here are some outlines:
Team:
Team(
name=“Team of agents”,
team_id=“team_id”,
mode=“coordinate”,
model=OpenAIChat(id=AGENT_MODEL),
members=[
agent1,
agent2,
agent3,
],
tools=[ReasoningTools(add_instructions=True)],
instructions=,
markdown=True,
enable_agentic_context=False,
add_datetime_to_instructions=True,
debug_mode=AGENT_DEBUG_MODE,
show_tool_calls=AGENT_SHOW_TOOL_CALLS,
stream_intermediate_steps=AGENT_SHOW_TOOL_CALLS,
memory=Memory(
db=PostgresMemoryDb(
table_name=“leader_memory”,
db_url=DB_URL,
schema=DB_SCHEMA
)
),
show_members_responses=True,
enable_user_memories=True,
enable_session_summaries=False,
storage=storage,
share_member_interactions=False,
add_history_to_messages=True,
read_team_history=False,
num_history_runs=1,
)


Agent(
name=“Agent 1”,
role=“Role of Agent 1”,
model=OpenAIChat(id=AGENT_MODEL),
tools=tools,
description=“Tou are the agent N1”,
instructions=instructions,
show_tool_calls=AGENT_SHOW_TOOL_CALLS,
stream_intermediate_steps=AGENT_SHOW_TOOL_CALLS,
debug_mode=AGENT_DEBUG_MODE,
search_knowledge=True,
update_knowledge=False,
memory=Memory(
db=PostgresMemoryDb(
table_name=“agent1_agent_memory”,
db_url=DB_URL,
schema=DB_SCHEMA
)
),
enable_user_memories=False,
enable_session_summaries=False,
knowledge=knowledge_base,
add_history_to_messages=True,
num_history_responses=1,
read_tool_call_history=False,
)


Also default storage:
storage = PostgresStorage(
table_name=“agent_sessions”,
db_url=DB_URL,
schema=DB_SCHEMA,
mode=“team”,
auto_upgrade_schema=True
)

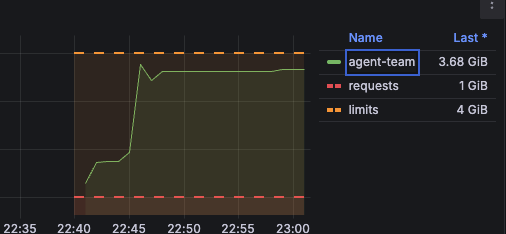
The configuration is default. Memory leak is visible permanently the more request is made the bigger the memory usage gets without dropping.
Recently we tried to explore the heap dumps, unfortunatelly not much. We discovered that 80% of the memory is used by List and Dict.

Would really appreciate your help.

It is likely because the team session, which contains the member runs, keeps growing. I’ll investigate from our side as well.

Thank you for reply @Dirk
Do you maybe know some quick fix, or maybe somehow put all the sessions data directly to db/redis and read from there so we won’t overuse the memory?

So it currently loads all the runs for a session every time you run the team. Do you require to continue with the same session every run? Otherwise I can suggest that you make a new session_id that you pass to run on each run.

Does that make sense?

1 Like

@Dirk
Yes, it is already implemented in similar way. Many users can create many sessions(for each unique session_id). Is there any way to clean that somehow from memory, so the acual session data will be retrieved from DB on demand

@Dirk
We also updated to agno 1.7.1 from agno 1.7.0 since there was some commits regarding memory issue, but still the memory usage is always growing.

That is how it works today. When you run an agent with a provided session ID, only that session is loaded (see read_from_storage). And it is expected that the memory footprint would grow slightly with each run, because the runs list grows with the session.

We are talking about possibly only “hydrating” the current run on the session if you don’t use any history features, but in your case you are using history.

To clarify the original question, are you seeing that the memory grows with 1.2 GB after 10 single requests in parallel?

I want to also check, do you have images in your responses?

@Dirk
Yes, after calling run (same user, different session_ids) 10 times (run required 1-2 tool calls total from different agents)m we get around 4gb ram used. Attached the screenshot of our monitoring.
As you can see on the graf first small growth was produced by 10 simple queries to team (basically “hello”). The next huge call was produced with prompt that required agent 1-2 tool calls (x 10 times).
So we are kinda stuck with it, since we have not find out any method how to deal with it. Creating separate instance per request/user is also seem not really good solution.

Thanks for this. Trying to replicate from my side this result!

I just added this cookbook in an attempt to replicate. Still working on replicating, but if you could take a look at whether you think I am missing anything from my simple example that might be different from your approach.